17-50
User
Guide
for
the
Cisco
Application
Networking
Manager
5.2
OL-26572-01
Chapte
r
17
Monitoring
Your
Network
Configuring
Historical
Trend
and
Real
Time
Graphs
for
Devices
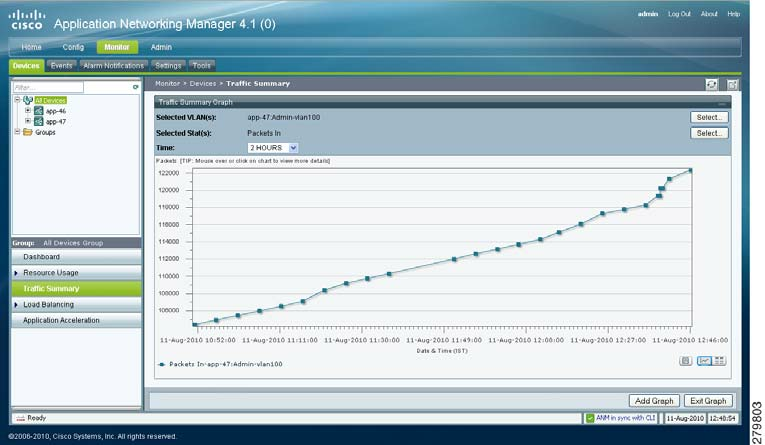
Figure
17-12
Displaying
Historical
Graphs
Step
4
(Optional)
To
enhance
your
viewing
of
the
graphs,
use
t
he
Collapse/Expand
buttons
to
minimize
or
maximize
a
graph
in
the
monitoring
window.
Step
5
(Optional)
Use
the
graphing
tools
described
in
Ta
b
l
e
17-17
to
modify
the
display.
Ta
b
l
e
17-
17
Hi
s
t
o
ri
c
a
l
G
ra
p
h
Too
l
s
To
o
l
Description
Add
Graph
button
Adds
a
gr
aph
to
t
he
selected
monitoring
window.
Vi
e
w
A
s
C
h
a
r
t
and
View
As
Grid
icons
Toggles
the
display
of
an
object
graph
in
the
monitoring
window
between
a
grid
and
a
gr
aph.
The
gri
d
displays
i
nclude
the
Export
to
Excel
hyperlink
that
al
lows
you
t
o
export
object
data
to
Microsoft
Excel
for
archiving
or
other
pur
poses.
Show
As
Image
icon
Allows
you
to
save
the
graph
as
a
JPEG
file
for
archiving
or
other
purposes.
When
you
mouse
over
the
graph,
the
Image
Toolbar
appears.
From
the
Image
Toolbar,
you
can
save
t
he
graph
as
a
JPE
G
or
send
i
t
i
n
an
e-mail.
You
can
also
print
the
graph
if
desired.