17-22


User
OL-26572-01


Chapter
Using

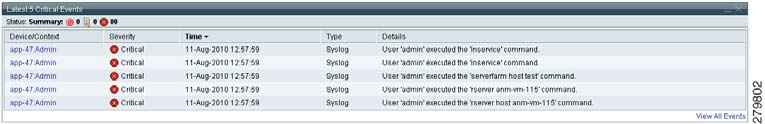
Figure
Latest
The
Device/Context—ACE
and
occurred.
Time—ANM
at
which
Type—Displays
in
or
a
Details—Additional
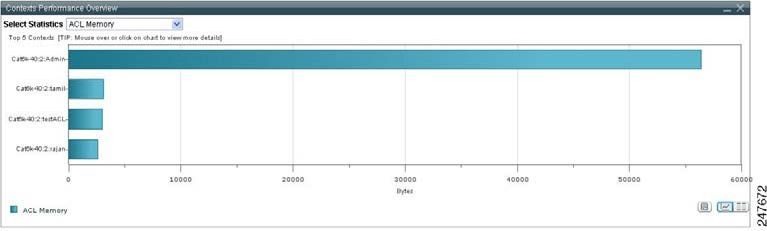
A
Contexts
The
user-configurable
from
resource
Figure
Context
To
Click
Vi
to
the
Click
Vi
to


Note
If
save
for
Show
button.
save
If


Excel