17-21

User
OL-26572-01


Chapter
Using

Max.—Highest
resource
on
Last
Time—Date
the
va
Hyperlinks
You
Resources
the
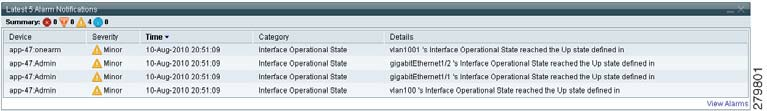
Latest
The
with
function
Figure
Latest


Note
By
This
Device—Name
ACE
Severity—
the
can
one
Info,
Minor.
Time—ANM
at
which
Category—Alarm
Details—Additional
A
Latest
The
devices,
of
been
syslogs
Cisco