17-11
User
Guide
for
the
Cisco
Application
Networking
Manager
5.2
OL-26572-01
Chapte
r
17
Monitoring
Your
Network
Using
Dashboards
to
Monitor
Devices
and
Virtual
Contexts
Control
Plane
CPU/Memory
Graphs
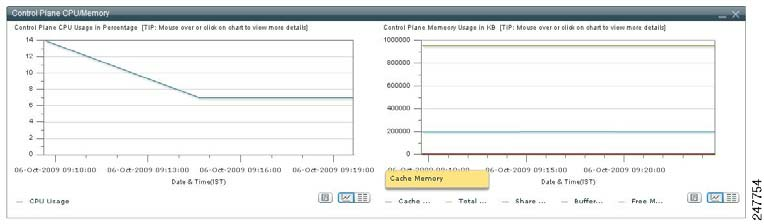
The
Control
Plane
CPU/Memory
graphs
(
Figure
17-4
)
show
the
utilization
of
the
ACE
CPU.
This
data
consists
of
two
graphs:
•
The
Control
Plane
CPU
Usage
graph
shows
the
utilization
of
the
ACE
CPU
as
a
percentage.
•
The
Control
Plane
Memory
graph
displays
the
consumed
memory
on
Kbytes.
A
tooltip
is
added
to
display
the
Cache
Memory,
Total
Memory,
Shared
Memory,
Buffer
Memory,
and
Free
Memory
usage
as
a
percentage.
To
toggle
the
display
of
the
Control
Plane
CPU/Memory
graph
in
the
monitoring
window:
•
Click
Vi
e
w
As
C
h
a
r
t
to
display
the
object
data
as
a
graph.
•
Click
Vi
e
w
As
Gr
i
d
to
display
the
object
data
as
a
numerical
line
grid.
Note
If
you
want
t
o
save
the
gr
aph
as
a
JPEG
file
for
ar
chive
or
ot
her
pur
poses,
click
t
he
Show
As
Image
button.
When
you
mouse
over
the
graph,
the
Image
Toolbar
appears.
From
t
he
Image
Toolbar,
you
can
save
the
graph
as
a
JPEG
or
send
it
in
an
email.
You
can
also
print
the
graph
if
desired.
If
you
want
to
export
object
data
to
Microsoft
Excel
for
archive
or
other
purposes,
click
the
Export
to
Excel
link
in
the
View
As
Grid
object
display.
Figure
17-4
Control
Plane
CPU/Memory
Graphs