17-10


User
OL-26572-01


Chapter
Using

Hyperlinks


Note
ACL
only)


hyperlink
Top
The
evaluated
is
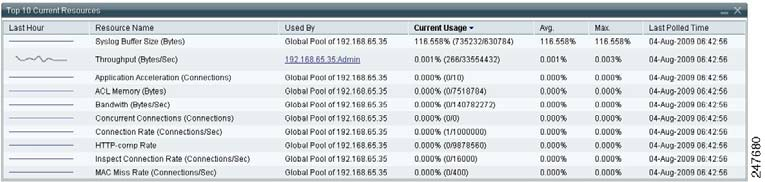
Figure
Top
This
Last
resource
Resource
the
Used
is
Pool
global
situation,


Note
Contexts
for
the
10


Usage
Current
rate
the
Average—Average
Max.—Highest
resource
on
Last
Time—Date
the
va
Hyperlinks
You
Resources
the